European Soccer: A look at home-field advantage, trends and predictability in the best European Leagues
European Football Through the Years
Note: Football and Soccer will be used interchangeably. Also, the letters “H”, “D”, “A” will be used throughout this post to illustrate, respectively, “Home win”, “Draw”, “Away win”.
We will start this adventure by taking a look at 5 of Europe’s most competitive leagues (England, Germany, France, Italy and Spain). These are the most traditional of the leagues and there is widely available data on the match fixtures dating back a while ago. We will be first diving into the fixtures between 1995 and 2019 and see if there are any trends.
Home-Field Advantage has been consistent over the years
A quick look at the chart below shows just how important it is to play at home. Aggregating data across all 5 leagues, we see the shocking gap between home and away performance.

If we try a different kind of grouping, by league/country, rather than by year, we see the same phenomena in each subgroup. The trend is consistent, we see a near identical distribution of home wins across the 5 major leagues, with home teams on the aggregate being expected to win almost half of their encounters:

Home-court advantage is becoming less relevant
At first glance, if you take a look at the absolute mean goal difference in games, it seems like it has been pretty constant over the years, just above a difference of 1.25 per game. This can be seen in the graph below, but this does not tell the whole story…

Not take a look at the next plot, separated in colors for each of the leagues. When you look at the goal difference from the perspective of the home team (meaning a loss at home would count as a negative goal difference), we see that the average goal difference

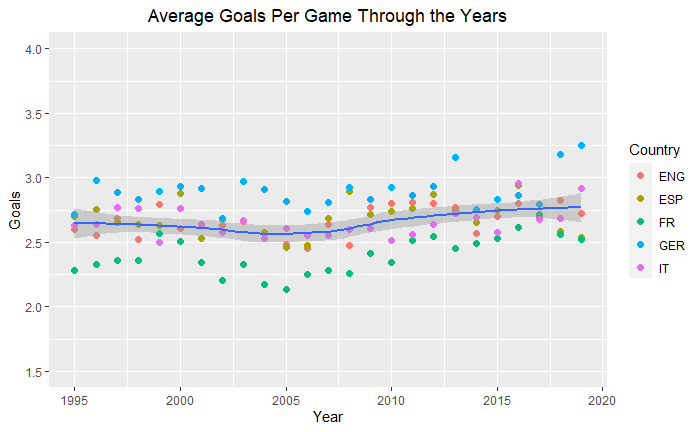
This could potentially be because of diminishing number of goals per game or strengthening of defense systems. However, as shown in the plot below,this is not the case, as the average number of goals per game has kept almost constant (or if anything has risen slightly) over the years. It’s also worth noting how the different leagues have different similar trends, but shifted. For example, the German league has the highest goal per game average, whilst the French league has much lower averages.
All of this is great, but it paints the picture of the last decades of soccer in the old continent. What about a more recent, focused analysis? Let us take a look at something more specific.
A look at the 2019–2020 Season
With the pandemic, soccer changed a lot. No more fans, weird game schedules, different and unprecedented changes in the way games are played and even how in shape players are. With that in mind, let us dive deeper into the first season of European football that was interrupted by COVID. In this section we will look into data from 8 of the most competitive leagues (England, Germany, France, Italy, Spain, Turkey, Portugal, and Netherlands), but ONLY for the 2019/2020 Season this time.
Home-court advantage is reflected in all leagues
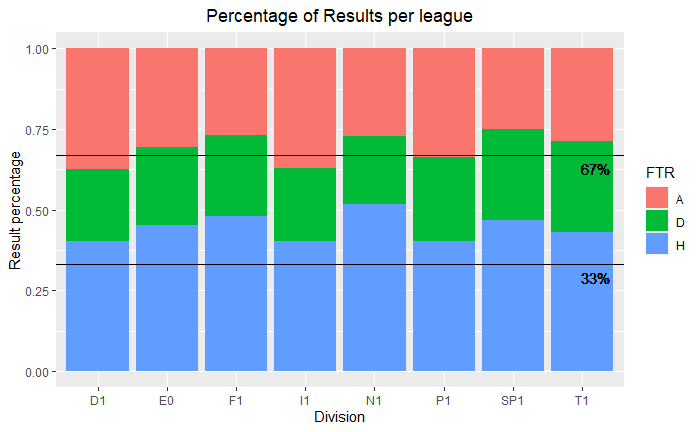
Illustrated in the graph are the win, draw and loss percentages of all games. We see that for all 8 leagues, the home team has a significant higher chance of victory (note that 1/3 and 2/3 reference lines).
Importance of the final half:
We saw that full time results tend to favor the home team, but what about the distribution of goals during games? We will see in the next chart, that across all leagues, we see that both home and away teams score significantly more in the second half, but that the absolute difference in goals scored by the home team is considerable, and help elucidate the results on full-time score.
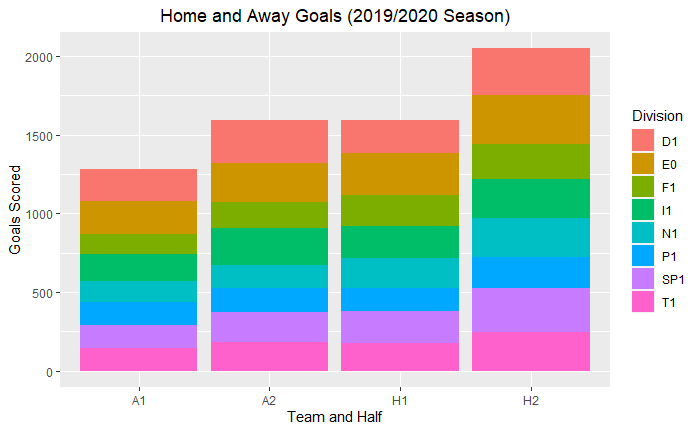
Below we see a plot (separated in colors for each league), the sum of goals scored by home and away teams in half 1 and 2 (H1 = Home Half 1, A1 = Home Half 2, and so on). We see that for both home and away teams, they are more likely to score goals in the latter half. However, home teams also score more goals on average. The last column shows that most goals are scored by home teams and in the second half. Late-game winners or equalizers seem to help explain the superiority of home teams, backed by fans in the final stretch.
This trend repeats itself across most of the match statistics. It becomes clear that at home, teams not only win, but they genuinely play better (although this might seem obvious, soccer is one of those sports where the team that plays better often loses). See below the breakdown for a few different match statistics.
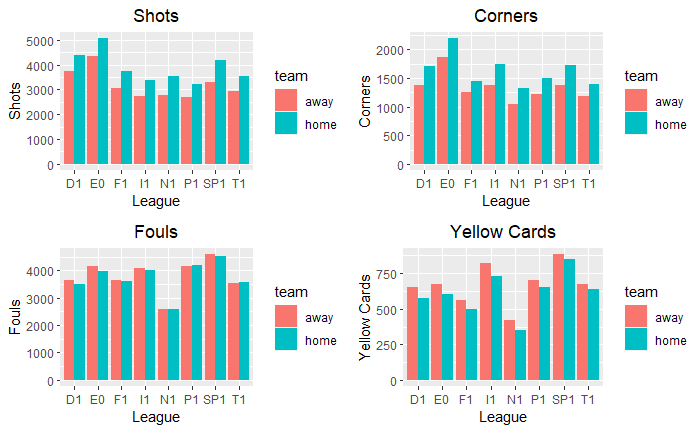
Above we see that home teams attempt more shots on target, take more corner kicks, commit less fouls and are booked with yellow cards way less often. We note that English and German leagues attempt more shots than the other leagues, but particularly that the Dutch League (N1) seems to have much fewer fouls and yellow cards. Funny because this could mean that they play less aggressively, or either more aggressively to the point where referees don’t award common place fouls.
It seems that when playing at home, teams play a more offensive style, and are safer on the defensive end, without having to resort to fouls. This can be attributed to a myriad of factors such as being familiar with the pitch and grounds, but one of them surely concerns home fans, and how they can shift power.
Attendance on the English Premier League (EPL)
To add value to our analysis, I decided to scrape data from https://www.footballcritic.com/ to find data on the attendance from every specific game for the English Premier League on that season. We have full attendance data up to match-day 29, and after match-day 30 it drops to zero because games started to be held with no crowd.
Once this data is scraped, a good first attempt is to try and see if attendance correlated to any significant match statistic:
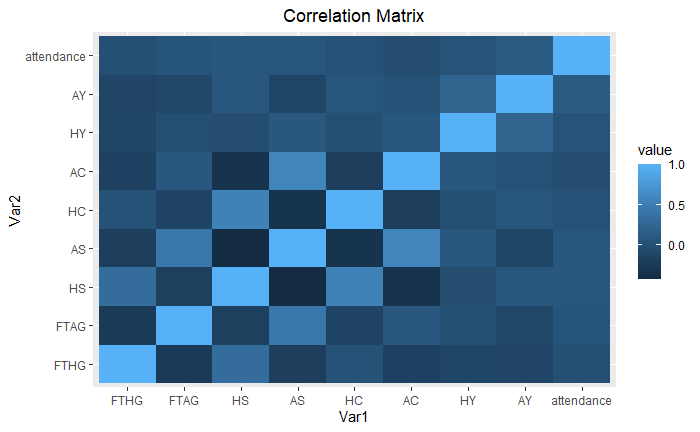
Unfortunately, as it turns out, the correlation for any of the match statistics with attendance is very small, I believe in part because the overall, absolute numbers change very little, regardless of how many fans there are. Therefore, having discarded this, we can move on and try grouping by each individual team to try and better spot trends.
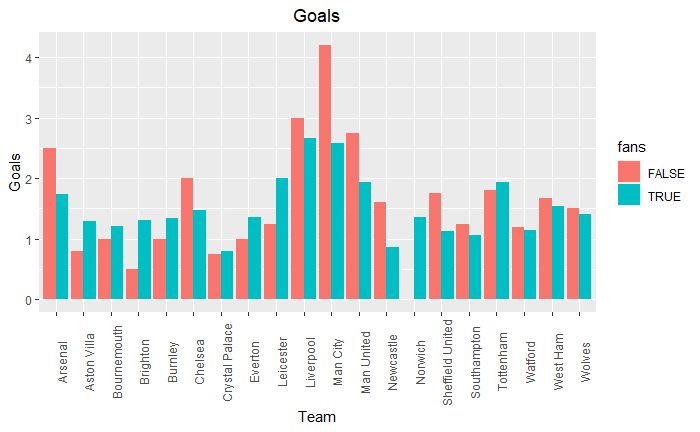
We can see that with and without fans, numbers drastically change (albeit there is a small sample size of games with no crowd). Poor Norwich who were on a solid 1.4 goals per game when playing at home failed to score a single home goal when playing in front of no crowd.
An interesting trend that can be picked up is the difference between the “big” and “traditional teams” seem to follow an opposite trend. Only 5 teams had a higher home-scoring average with no crowd, as compared to before: Arsenal, Chelsea, Leicester, Liverpool, Manchester City and Manchester United, five out of the “big six” English teams. Now, this is hard to explain when it comes to relating to attendance, after all correlation is not causation. I hypothesize that this was due to the fact that the big name teams had better facilities to keep training and conditioning in the weeks prior to the return of football due to the pandemic. Further analysis on this would be interesting.
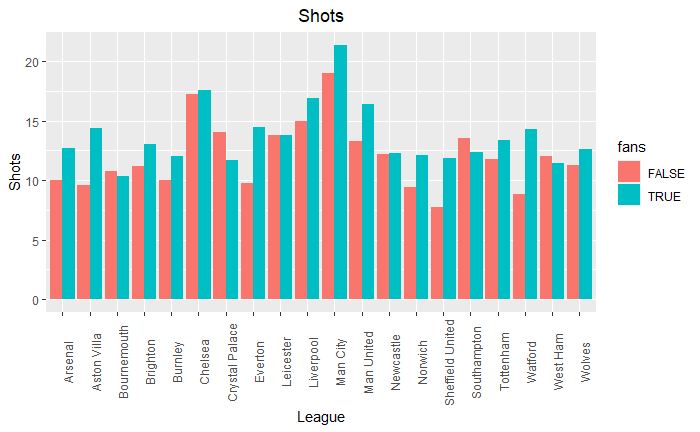
In-game changes with no crowd generalizes to other match statistics, but I will illustrate it using shot attempts by the home team. We see a consistent trend of teams being less aggressive and taking less shots with no fans, which is even weirder when you consider that defenses came back from the pandemic completely disorganized.
Recap
Overall, we see that in the English Premier League, but in general throughout the European leagues, we see interesting relationships between home-court advantage and in-game stats and match outcomes. This analysis was further complemented by analysis of attendance in the EPL and a pre/post COVID analysis of these same stats. Now, let’s try and take match stats to another level and do predictive analysis on match outcomes.
Predicting Game Outcomes
Soccer is often viewed as one of the most unpredictable sports, where underdogs often are able to fearlessly face the giants of the game, but how much of this is true. Is it possible to reasonably predict game outcomes based on the (few) statistics that are tracked, and other factors?
Linear Regression on Goals Scored
To try and predict game outcomes, the first approach was to run linear regression to predict how many goals would be scored in a particular game, given the Division, Home Team, Away Team ad a few statistics such as shot attempts and fouls. The overall training accuracy was of 54.9%.
Testing Model on New Data (Test Set)
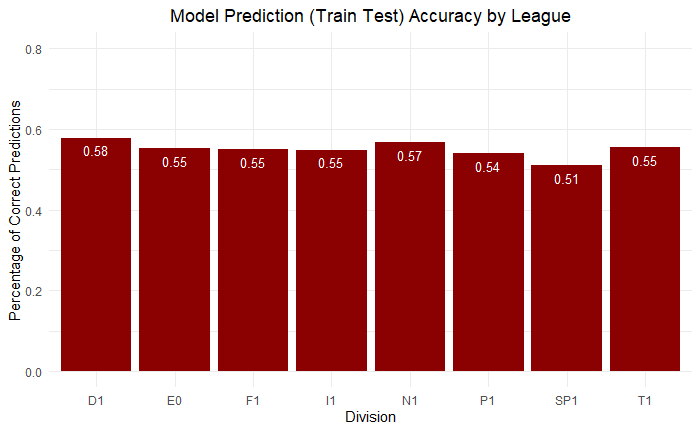
Now we have seen what our model can do, but how would it work on new data it has not trained on? Well, the chart below helps illustrate that. The overall test accuracy score was of 48.6%.
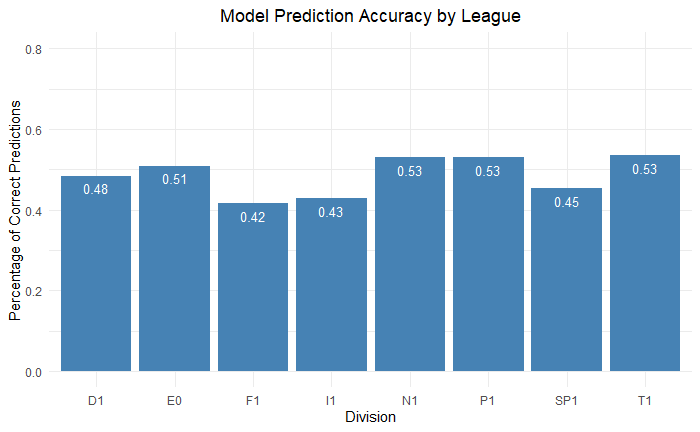
As you can see, the model, depending on the league, was very accurate, often very similar accuracy to the training data, which is very good! More importantly, these accuracies are generally better than just guessing one of the three possible game outcomes (Win, Loss, Draw), and better than simply assigning Home wins for all teams.
However, there is still a lot of room for improvement… This model is fairly simplistic, and we can see that our model clearly overfit in regards to, for example, the french league, which has high training accuracy and low test accuracy.
Decision Trees (rpart)
Another attempt to use classification is to use decision trees. The issue with this is that if you use team names as factors, the model becomes too complex. Therefore, we will use a bit of a hack. We will use the match facts from the actual game to predict the match outcome. So, for example, given the division, the number of shots by each team, number of fouls, etc… we attempt to predict if it is a home win, away win or a draw. I obtained a train accuracy score of 59.9% and a test accuracy of 55.8%. This led to the following decision tree:

We then apply these to predict on the train and test sets. See the results below:
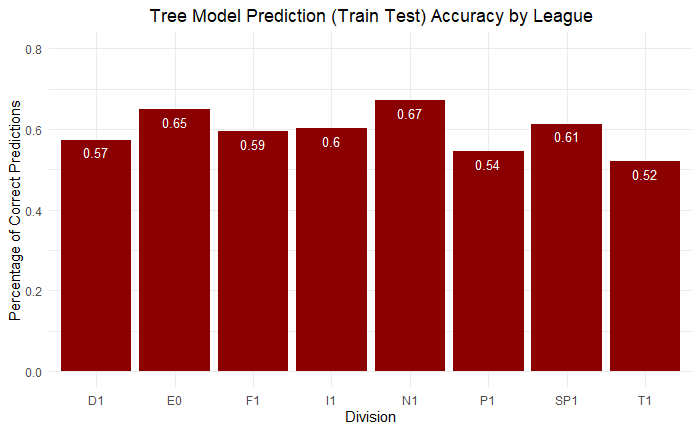
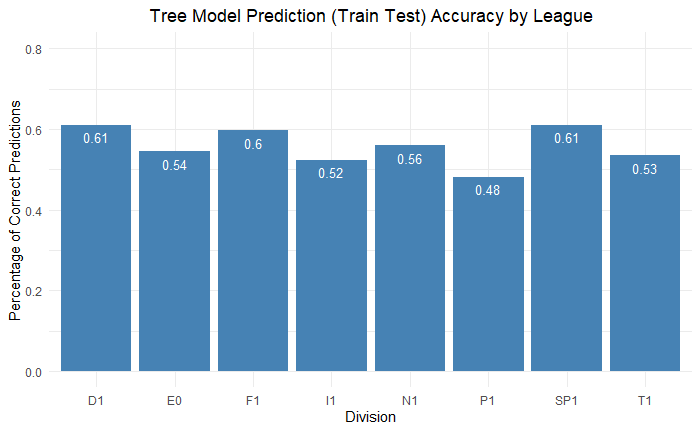
As you can see, this provides slight improvements compared to the linear regression model, and with test results that are almost just as good as the train results.
A lot more work could be done. For example, data on specific players (such as injuries, average squad age, etc…) could be incorporated, as well as weather data (for example rainy or not rainy on he location and date of a game). All of these are interesting, but increase the complexity of the model exponentially, which would add massive overhead and could lead to overfitting.
All in all I am pleasantly surprised with the results demonstrated by the predictive methods. Football is often see as very unpredictable and being able to pinpoint results in this fashion is impressive.
Conclusion
In this grand exploration, we have seen all sorts of different trends in terms of field advantage and in-game stats across the years, with a quick deep dive into the 2019/2020 season of English football, and finally a look at predicting using ML methods such as Linear Regression and Decision Tree classifiers.
We have learned home-field advantage is more than just a popular belief, but rather a reality backed by the numbers across all major European soccer leagues. We also saw the effects of the pandemic and of having fans (with the help of data scraping) on the 2019/2020 season and finally we have shown that with relatively unsophisticated methods, we can obtain predictions that come close to 50% accuracy, which could potentially be useful in sports betting.
Data Acquisition
The bulk of this project’s data was acquired from ready datasets on Kaggle:
- Big 5 European Leagues: https://www.kaggle.com/hikne707/big-five-european-soccer-leagues
- European Football Database: https://www.kaggle.com/adityadesai13/european-football-database-20192020?select=D1.csv
Web Scraping was also used to find attendance numbers for the 2019/2020 season of the EPL. The data was scraped from: https://www.footballcritic.com/